

not logged in | [Login]
![]()
Scenario Toolchain Steps
Previous step
Next step
This is the second step of the analysis at national level.
For the identified representative cities/areas analyses on the costs and potentials for the heat supply with district heating can be performed. For these analyses, Hotmaps provides various default data layers in the Hotmaps database as well as different Calculation Modules (CMs). Also, own data can be uploaded and used. These analyses can consist of the following steps:
The following figure shows this procedure graphically and shows the various data sources and calculation modules that can be used.
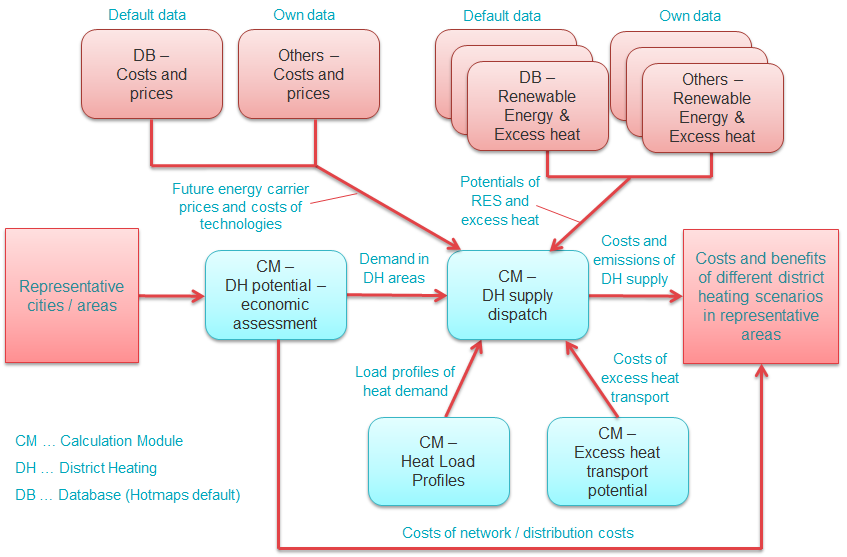 Figure: Analysis of costs and potentials for district heating in representative cities/regions (Step 2)
In the following sub-chapters, the different steps in this procedure are described in more detail.
For the representative cities/areas, an economic assessment of district heating can be performed to gain more detailed insights on the costs and economic feasibility of district heating and the amount of heat potentially supplied by district heating in the areas. For this purpose the CM - District heating potential: economic assessment can be used. This module generates a map of potential district heating areas based on an assessment of the heat distribution costs. An analysis of the feasibility of district heating in the analysed areas can be assessed in the following way:
The scenarios can be used to analyse the influence of the different factors on the heat distribution costs in district heating systems in the different representative cities/areas. For different settings of depreciation time and interest rate, one scenario of district heating expansion per representative city/area should be selected for further analysis.
The outcomes of this step are the heat demand for district heating [GWh/yr] and the heat distribution costs [EUR/MWh] in each of the representative cities/areas. These results will then be used in the overall scenario comparison in step 4.
In order to estimate the costs of transporting excess heat from potential sources outside of district heating areas to potential district heating areas, the CM - Excess heat transport potential can be used. The module yields levelised costs of excess heat transported to the district heating grid [EUR/MWh]. This can further be used in the next step of calculating heat supply costs in district heating.
Renovation of buildings leads to reductions in energy demand for space heating. This also affects the load profiles of heat demand in the district heating systems: the peak demands in winter decrease and the full load hours increase due to higher shares of hot water generation on the overall heat demand. With the CM - Heat load profiles future heat load profiles can be developed according to different heat-saving levels. This can be done based on load profiles provided in the Hotmaps database (default profiles for all NUTS2 regions in Europe) or based on your own profiles uploaded into the toolbox. The resulting load profiles are then used in the next step, the calculation of costs and emission of heat supply in district heating with the dispatch module.
The costs and emissions of heat supply in the district heating system depend on the interaction of the different installed supply capacities. Hereby the least-cost combination of capacities and their operation over time is of interest. In order to analyse the so-called hourly dispatch of different supply technology combinations and the effect on the overall costs and emissions of heat supply in district heating the CM - District heating supply dispatch can be used. With the module several scenarios with the following input data combinations can be calculated in order to derive costs and benefits:
The calculations can be used to identify beneficial supply portfolios in the different representative cities/areas and their sensitivity to important influencing parameters like energy carrier and CO2 prices or interest rate and depreciation time.
The outcomes of this step are the heat supply costs to the district heating system [EUR/MWh] in each of the representative cities/areas and the related CO2 emissions [kt/yr]. These results will then be used in the overall scenario comparison in step 4.
Marcus Hummel, Giulia Conforto, in Hotmaps-Wiki, Guidelines for using the Hotmaps toolbox for analyses at national level (August 2020)
This page was written by Marcus Hummel and Giulia Conforto (e-think).
☑ This page was reviewed by Mostafa Fallahnejad (EEG - TU Wien).
Copyright © 2016-2020: Marcus Hummel, Giulia Conforto
Creative Commons Attribution 4.0 International License
This work is licensed under a Creative Commons CC BY 4.0 International License.
SPDX-License-Identifier: CC-BY-4.0
License-Text: https://spdx.org/licenses/CC-BY-4.0.html
We would like to convey our deepest appreciation to the Horizon 2020 Hotmaps Project (Grant Agreement number 723677), which provided the funding to carry out the present investigation.
View in another language:
Bulgarian* Czech* Danish* German* Greek* Spanish* Estonian* Finnish* French* Irish* Croatian* Hungarian* Italian* Lithuanian* Latvian* Maltese* Dutch* Polish* Portuguese (Portugal, Brazil)* Romanian* Slovak* Slovenian* Swedish*
* machine translated