
not logged in | [Login]
Disclaimer: The explanation provided on this website (Hotmaps Wiki) are indicative and for research purposes only. No responsibility is taken for the accuracy of the provided information, explanations and figures or for using them for unintended purposes.
Data privacy: By clicking OK below, you accept that this website may use cookies.
This module aims to highlight the heatsource that can be classify as: suitable, conditionally suitable and not suitable for an energy exploitation at urban level.
Potentially, in a urban or regional areas, there are several resources that might be used t provide thermal energy (for heating and/or cooling purpose). This module aims to classify the different heat source based on their suitability. The module classify the systems in three main categories: Suitable, Conditionally suitable, Not suitable. The module return a vector map with the classified points, and return the power as classified for each class. This module generates a shapefile classifying the heat source potential based on the distance of the heat source from the demand, and based on the capacity of the heatsource. Each heat source is classified in three main classes:
The module automatize the methodology as defined by:
Neugebauer, Georg, Florian Kretschmer, René Kollmann, Michael Narodoslawsky, Thomas Ertl, and Gernot Stoeglehner. ‘Mapping Thermal Energy Resource Potentials from Wastewater Treatment Plants’. Sustainability 7, no. 10 (September 2015): 12988–13010. https://doi.org/10.3390/su71012988.
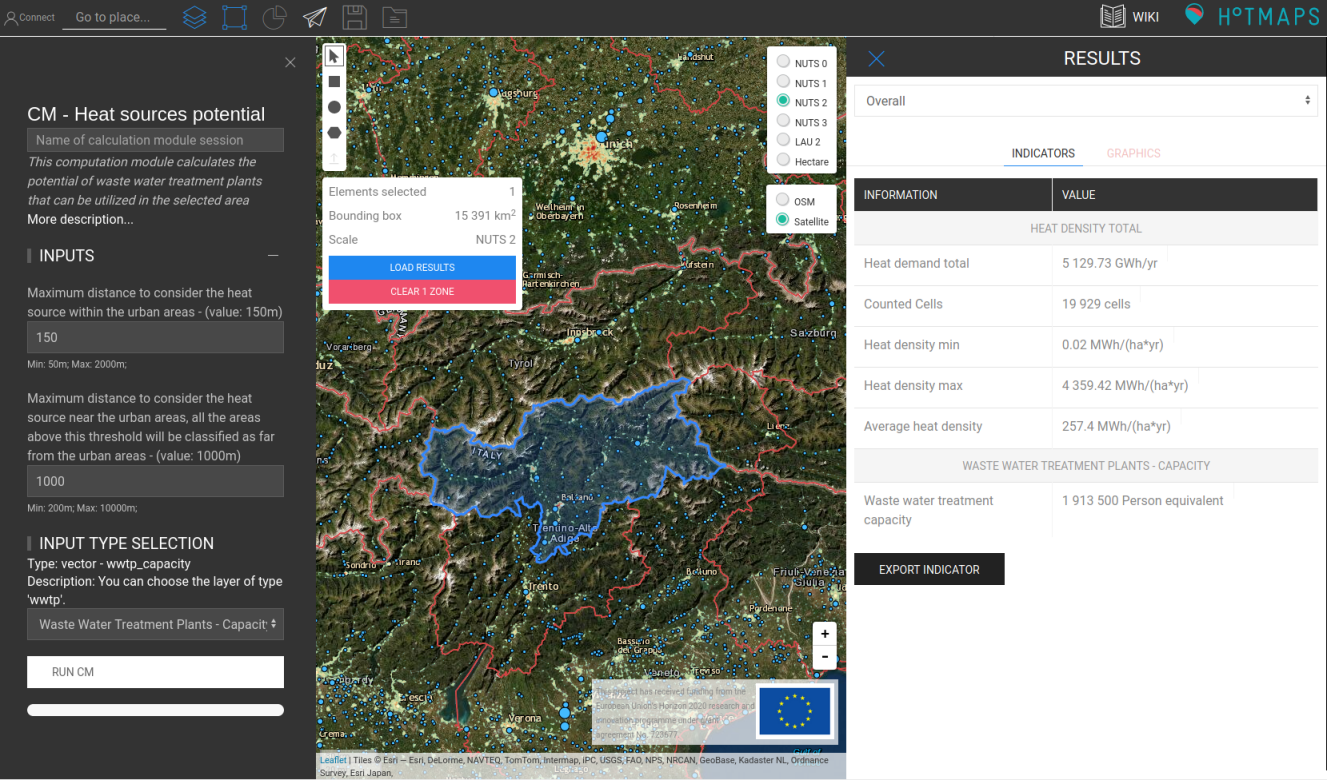
The input parameters and layers as well as output layers and parameters are as follows.
Input layers and parameters are:
gid, capacity.Heat source power, is a vector map with the power that can be used. The mandatory columns are: gid, capacity, with gid that must beconsistent with values used in the capacity layer.
The user can defne the maximum distance to consider the heat source within the urban areas (default value: 150m): within_dist.
near_dist
Output layers and parameters are:
We follow the methodology defined by:
Neugebauer, Georg, Florian Kretschmer, René Kollmann, Michael Narodoslawsky, Thomas Ertl, and Gernot Stoeglehner. ‘Mapping Thermal Energy Resource Potentials from Wastewater Treatment Plants’. Sustainability 7, no. 10 (September 2015): 12988–13010. https://doi.org/10.3390/su71012988
As default data sets we used the WWTP capacity and power datasets.
The urban areas are defined from the Corine Land Cover data set, where we consider as urban anly the following categories:
To define the urban areas, the module start from the Corine Land Cover (CLC) dataset and select the following categories:
Then to assess and classify the potential, the module:
Within (dist < within_dist) |
Near (dist < near_dist) |
Far (dist > near_dist) |
|
|---|---|---|---|
| Small (2000 - 5000 PE) | Conditionally | Conditionally | Not suitable |
| Medium-small (5001 - 50000 PE) | Suitable | Conditionally | Conditionally |
| Medium-high (50001 - 150000 PE) | Suitable | Suitable | Conditionally |
| High ( > 150000 PE) | Suitable | Suitable | Suitable |
Here you get the bleeding-edge development for this calculation module.

Pietro Zambelli, in Hotmaps-Wiki, CM-Heatsource-potential (September 2020)
This page was written by Pietro Zambelli EURAC.
☑ This page was reviewed by Simon Pezzutto EURAC.
Copyright © 2016-2020: Pietro Zambelli
Creative Commons Attribution 4.0 International License
This work is licensed under a Creative Commons CC BY 4.0 International License.
SPDX-License-Identifier: CC-BY-4.0
License-Text: https://spdx.org/licenses/CC-BY-4.0.html
We would like to convey our deepest appreciation to the Horizon 2020 Hotmaps Project (Grant Agreement number 723677), which provided the funding to carry out the present investigation.
View in another language:
Bulgarian* Czech* Danish* German* Greek* Spanish* Estonian* Finnish* French* Irish* Croatian* Hungarian* Italian* Lithuanian* Latvian* Maltese* Dutch* Polish* Portuguese (Portugal, Brazil)* Romanian* Slovak* Slovenian* Swedish*
* machine translated
Last edited by web, 2020-09-30 11:29:36