

not logged in | [Login]
![]()
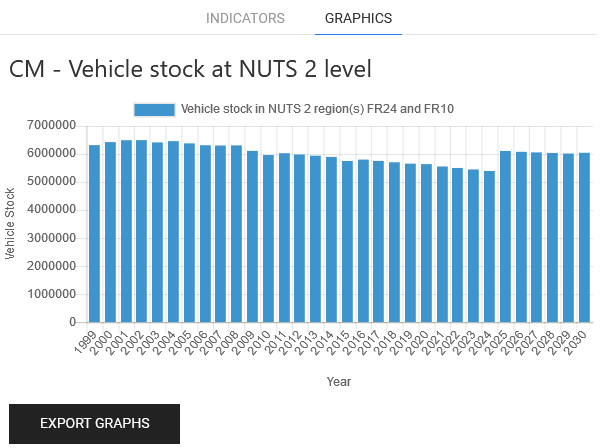
This calculation module demonstrates the vehicle stock profile in NUTS 2 level from 1990 up to year 2030 based on a business as usual scenario. The data set can be found in Hotmaps data set repositories as well. The illustrated numbers on the NUTS 2 level, were extrapolated based on values on NUTS 0 data. The historical data points were extrapolated based on future trends for selected indicators derived from the PRIMES–TREMOVE EU 2016 reference scenario.
This calculation module demonstrates the vehicle stock profile in NUTS 2 level up to year 2030 based on a business as usual scenario. The data set can be found in Hotmaps repository as well. The illustrated numbers on the NUTS 2 level, were extrapolated based on values on NUTS 0 data. The historical data points were extrapolated based on future trends for selected indicators derived from the PRIMES–TREMOVE EU 2016 reference scenario [1].
The calculation module can be run on NUTS 2 level only.
Inputs: This CM requires no input parameter from user. The user should only select one or several NUTS 2 regions.
Outputs:
The NUTS2 data (2006) are the result of a spatial interpolation of the vehicle stock data at NUT0 level, using the NUTS2 data of the number of vehicle stock and the GDP at NUTS2 level as a proxy. Furthermore, the original 5 years resolution of the data at NUTS0 level has been interpolated with a yearly resolution. The results are shown in form of indicators and a graph.
It should be noted that in case of selection of two or more regions, an aggregated value is presented. Furthermore, it should be noted that the data is available for different periods depending on the NUTS 2 region (e.g. one region from 1999 to 2030 and the other one from 1995 to 2030). Therefore, in case of selection of two or more regions, the values from constituting regions should also be considered by the user.
Here you get the bleeding-edge development for this calculation module.

[1] European Commission, “EU Reference Scenario 2016.” [Online]. Available: https://data.europa.eu/euodp/data/dataset/energy-modelling.
Mostafa Fallahnejad, in Hotmaps-Wiki, CM-Vehicle-stock-at-NUTS-2-level (September 2020)
This page was written by Mostafa Fallahnejad (EEG - TU Wien).
☑ This page was reviewed by Marcul Hummel (e-think).
Copyright © 2016-2020: Mostafa Fallahnejad
Creative Commons Attribution 4.0 International License
This work is licensed under a Creative Commons CC BY 4.0 International License.
SPDX-License-Identifier: CC-BY-4.0
License-Text: https://spdx.org/licenses/CC-BY-4.0.html
We would like to convey our deepest appreciation to the Horizon 2020 Hotmaps Project (Grant Agreement number 723677), which provided the funding to carry out the present investigation.
View in another language:
Bulgarian* Czech* Danish* German* Greek* Spanish* Estonian* Finnish* French* Irish* Croatian* Hungarian* Italian* Lithuanian* Latvian* Maltese* Dutch* Polish* Portuguese (Portugal, Brazil)* Romanian* Slovak* Slovenian* Swedish*
* machine translated