

not logged in | [Login]
![]()
This module calculates the potential of shallow geothermal energy to be used in ground source heat pumps for selected regions in the form of a raster file. The inputs are raster files with initial ground temperatures, depth-averaged ground thermal conductivity and depth-averaged ground thermal capacity.
The calculation module aims to compute the shallow geothermal potential based on r.green.gshp.theoretical according to the G.pot methodology. In this module, the output is the theoretical maximum energy that can be converted in the ideal case without considering the financial and spatial constraints.
The input parameters and layers, as well as output layers and parameters, are as follows.
Input layers and parameters are:
The advance input parameters are:
Output layers and parameters are:
A deeper explanation of the default input raster is available in the Hotmaps repository
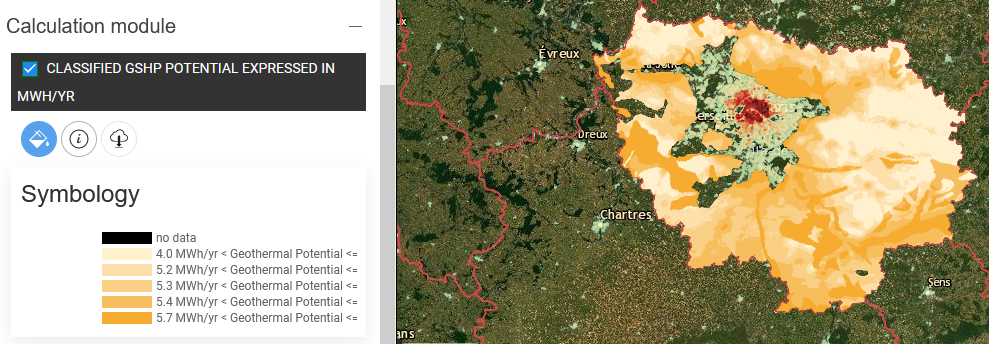
It is also worth-mentioning that due to the fact that implementation of geothermal system is not always possible, specially in the a very dense city areas, the input raster file does not provide information for several large cities. This is also visible in the output files and is NOT a mistake in the calculation.
The method to define the energy potential is based on the G.pot. The potential of shallow geothermal energy is computed by means of and empirical relationship proposed by Casasso et al. (2016).
The methodology produce a map with the power and the energy that can be extracted considering the main characteristics of the terrain (e.g. ground temperature/capacity/conductivity) and of the Borehole (e.g. length, diameter, etc).
Here you get the bleeding-edge development for this calculation module.
Users can give different ground characteristics (e.g. ground temperature, ground conductivity and capacity), if available. It is also possible to define the different characteristics of the geothermal system like the Borehole geometry.
As previously mentioned, a raster layer is generated as output. This layer shows the potential in different areas. As it is difficult to estimate the potential in dense urban areas, the input raster layer does not provide information for such regions. As a result, these regions are also empty in the output layer.
Pietro Zambelli and Giulia Garegnani, in Hotmaps Wiki, CM Shallow geothermal potential (September 2020)
This page was written by Giulia Garegnani and Pietro Zambelli (EURAC).
☑ This page was reviewed by Mostafa Fallahnejad (EEG - TU Wien).
Copyright © 2016-2020: Pietro Zambelli and Giulia Garegnani
Creative Commons Attribution 4.0 International License
This work is licensed under a Creative Commons CC BY 4.0 International License.
SPDX-License-Identifier: CC-BY-4.0
License-Text: https://spdx.org/licenses/CC-BY-4.0.html
We would like to convey our deepest appreciation to the Horizon 2020 Hotmaps Project (Grant Agreement number 723677), which provided the funding to carry out the present investigation.
View in another language:
* machine translated