

not logged in | [Login]
![]()
This module allows comparing different heating scenarios. The module is not integrated into the Hotmaps Toolbox, but it is provided as a separate Excel workbook that combines the results of other calculation modules to be previously run. The template as it is allows comparing up to 9 different scenarios, but if properly adapted, it can work for any number of scenarios. Separate worksheets are set up to collate the key indicators from each calculation module, while key indicators are automatically collated in the final table and represented in graphs.
SCENARIO ASSESSMENT WORKBOOK: CLICK HERE TO DOWNLOAD
The approach to assessing a number of different heating scenarios follows this sequence of calculations:
In each scenario, a certain split between central and decentral heat supply is assumed together with assumptions on the development of the heat demand in the region. For instance, a sensitivity analysis for a set of different district heating system sizes with different supply technologies may be compared. The scenario may vary by the capacity of the heat generators in the district heating system, the connection rates to the district heating system or the costs and prices for different technologies. Similarly, for decentral supply, various system parameters could be varied and the effects on the overall heating system in the region can be analyzed.
The user independently runs the different calculations modules for each scenario under consideration, copies the results into the relevant sheets of the Excel workbook, and then compares them for different scenario settings. This procedure is described in the following sections on this wiki page.
The inputs compiled into the scenario assessment workbook are generated with the following calculation modules:
1. CM - Decentral heating supply
2. CM - District heating supply dispatch
3. CM - District heating potential: economic assessment
The inputs and outputs of these modules should be saved for each scenario and then compiled into the scenario assessment workbook. The cells to be filled are properly marked and a colour-coding legend is reported on the first sheet of the workbook, as explained in the following paragraph Interpretation of input parameters. The three above-mentioned calculation modules require some inputs that you may already have, or that you may have to calculate running other modules, as specified in the following paragraph as well as in the Training section.
The sheet "Final Table" calculates and shows a comparison of the following indicators for each defined scenario both in the figures and in the charts:
For each scenario, the following indicators are shown in the form of a stacked bar chart:
The input parameters needed to run this module are divided into:
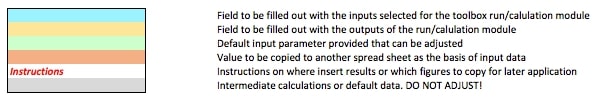
On top of these, the workbook has instructions in red text and additional calculations that should not be edited in grey cells. The picture below shows how the colour-coding indicated on the front sheet of the workbook looks like.
The sheet named "Final Table" mainly shows the overall output parameters both in figures and charts. Also, it has few input parameters that need to be provided by the user.
A Scenarios Table (R4:Z17) is ready to be filled with a short description of the different scenarios assessed. Placed right above the charts, this table can be a reminder for the user or clarification for other collaborators.
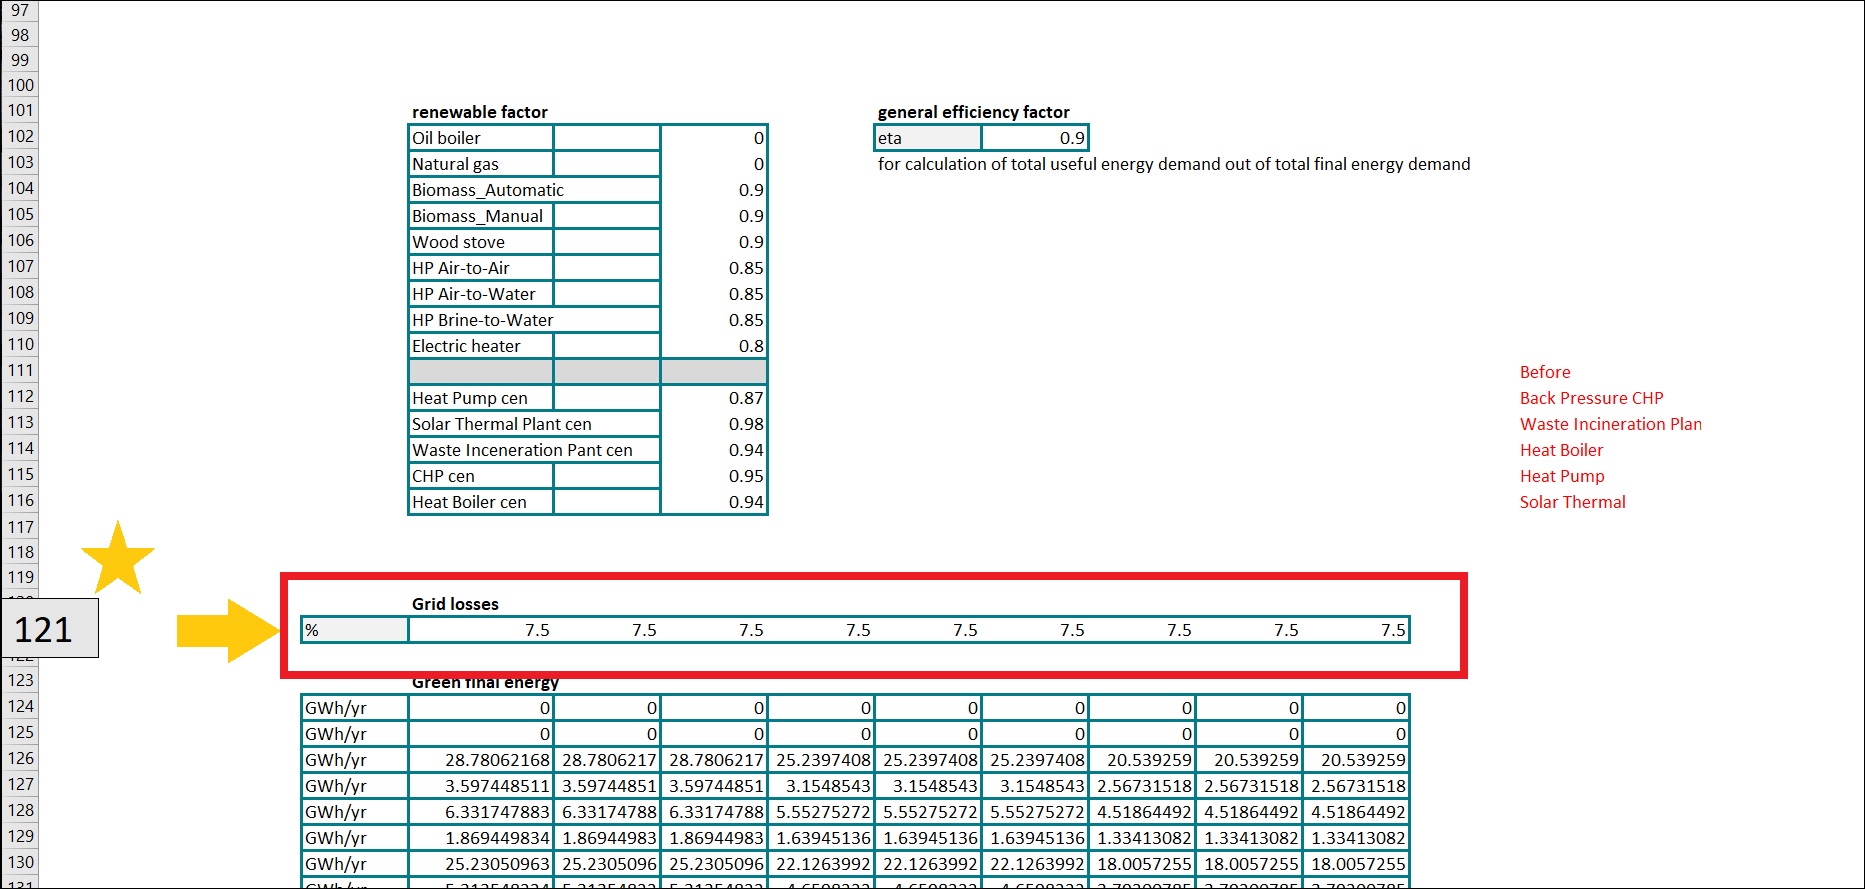
Further down in the sheet there are some parameters that have already been filled out, but can be adjusted, as long as they are not left empty:
A set of three sheets is used to describe the building stock of the region under investigation. The three sheets are used to collect the results of the CM - Decentral heating supply for single buildings, combine the single buildings to a building stock and to calculate the indicators for decentral heating supply needed for the overall scenario assessment. The content and filling of the different sheets is described in the following.
1. Single-family buildings This worksheet is prepared to collect the results of the CM - Decentral heating supply for single-family buildings. Two different types of single-family buildings can be taken into account in the default version of the workbook. However, the user can adapt the workbook in order to combine any number of different single-family buildings (e.g. from different construction periods or different types like detached or semi-detached).
2. MF & non-res buildings This worksheet is prepared to collect the results of the CM - Decentral heating supply for multi-family as well as non-residential (non-res) buildings. 8 different types of multi-family and non-residential buildings can be taken into account in the default version of the workbook. However, the user can adapt the workbook in order to combine any number of different multi-family and non-residential buildings (e.g. from different construction periods or different types like small multi-family buildings, apartment blocks, offices, hotels & restuarants, education, etc.).
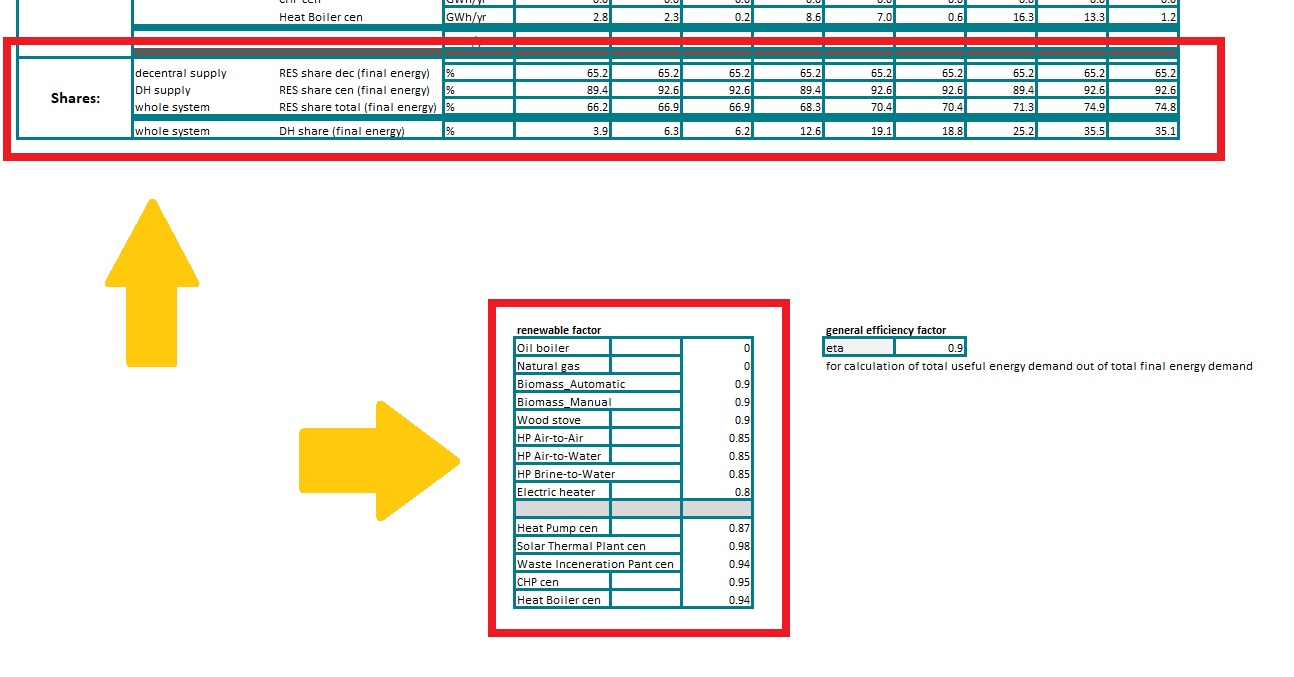
Building stock & Dec supply In this sheet, the building stock of the region under investigation is compiled out of the building types defined and calculated in the previous two worksheets (C15:L15). Furthermore, the split of technologies assumed to be used in the different building types is defined (C17:L25) and the indicators for decentral heating supply in the building stock are calculated (E44:E77). For this also the overall heat demand in the region under investigation (E9) as well as the assumed CO2-price (E10) have to be defined by the user.
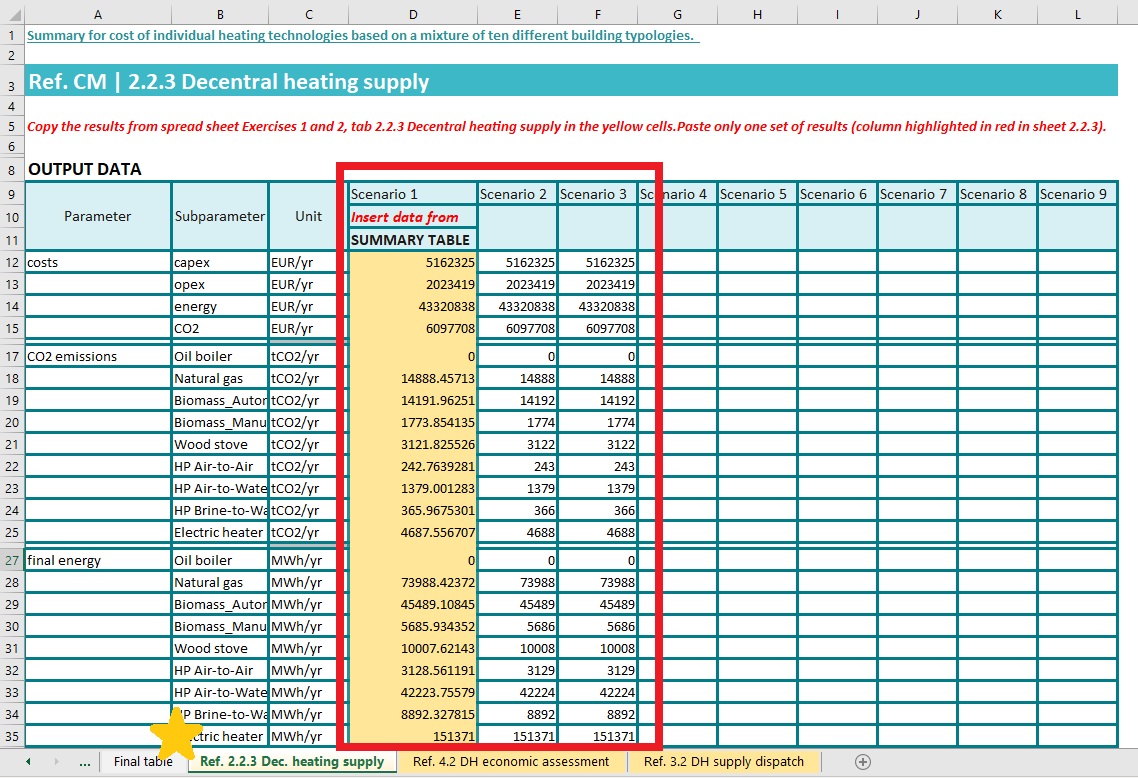
In this worksheet, various scenarios for decentral heating supply in the region under investigation can be defined. To do so, results from the calculation in the previous worksheet (Building stock & Dec supply, cells E44:E77) can be copied into the yellow marked cells in this worksheet. The worksheet in its default version is prepared to compile 9 different scenarios. The user is free to decide on which scenarios for decentral heating supply are collected in this sheet (e.g. different technology split in the different building types, different CO2 prices or different heat demands in the region).
In this worksheet, various scenarios for the construction of district heating grids in the region under investigation can be defined. To do so, the user runs different scenarios with the CM - District heating potential: economic assessment and copies the results of the module from the toolbox into this worksheet (cells C29:T44). Out of broader set of calucalted scenarios the user then chooses 9 scenarios to be used for the overall scenario assessment (C52:K67). The user is free to decide on which scenarios for the construction of district heating grids are collected in this sheet (e.g. different market shares of district heating in district heating areas, different grid cost ceilings or different overall heat demands in the region).
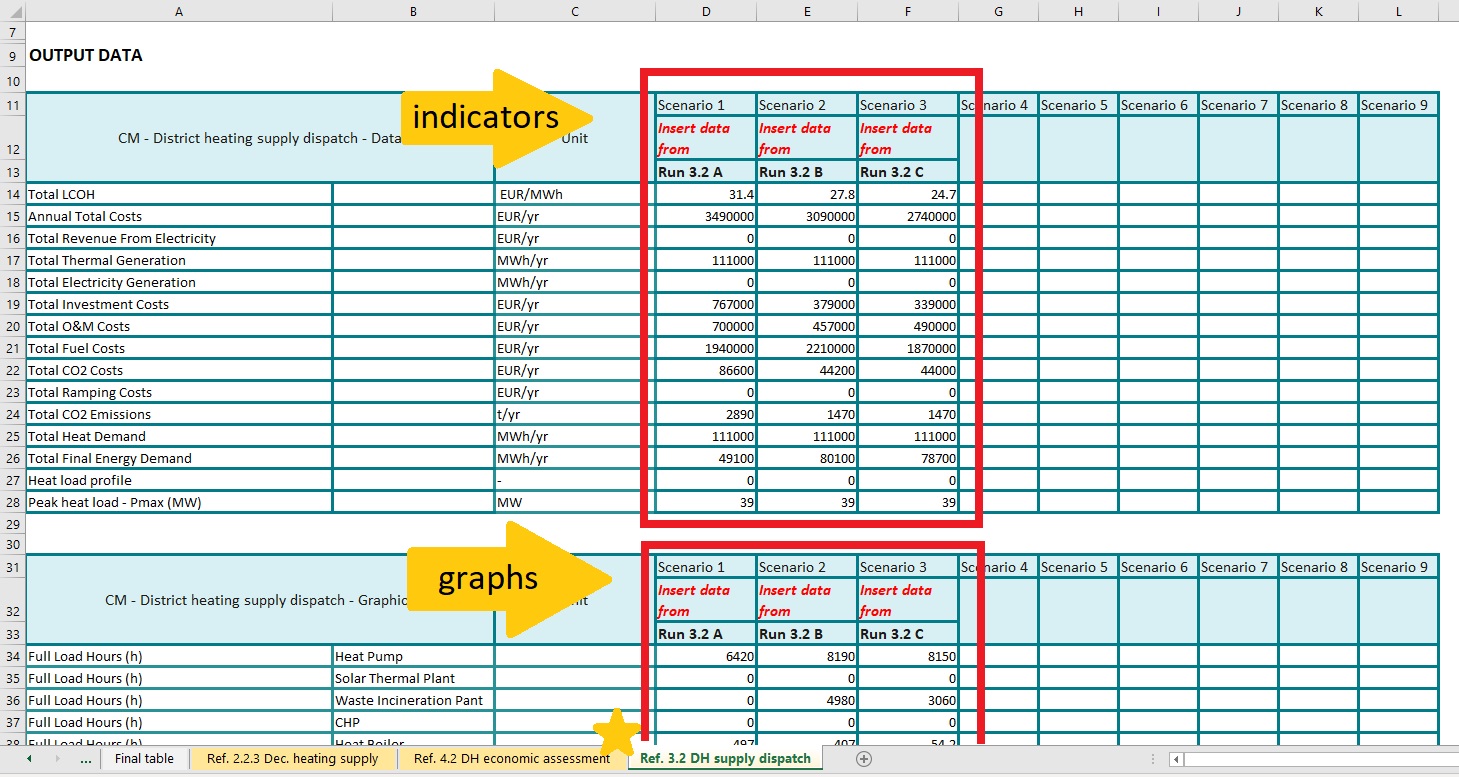
In this worksheet, various scenarios for the supply of heat to potential district heating systems can be defined. To do so, the user runs different scenarios with the CM - District heating supply dispatch and copies the results of the module from the toolbox into this worksheet (cells D84:L98 for the results in the section called "INDICATORS" and cells D104:L195 for the results in the section called "GRAPHICS"). The user is free to decide on which scenarios for the supply of heat to potential district heating systems are collected in this sheet (e.g. different combinations of technologies, different heat demands in the district heating systems, different CO2 prices or different energy carrier prices).
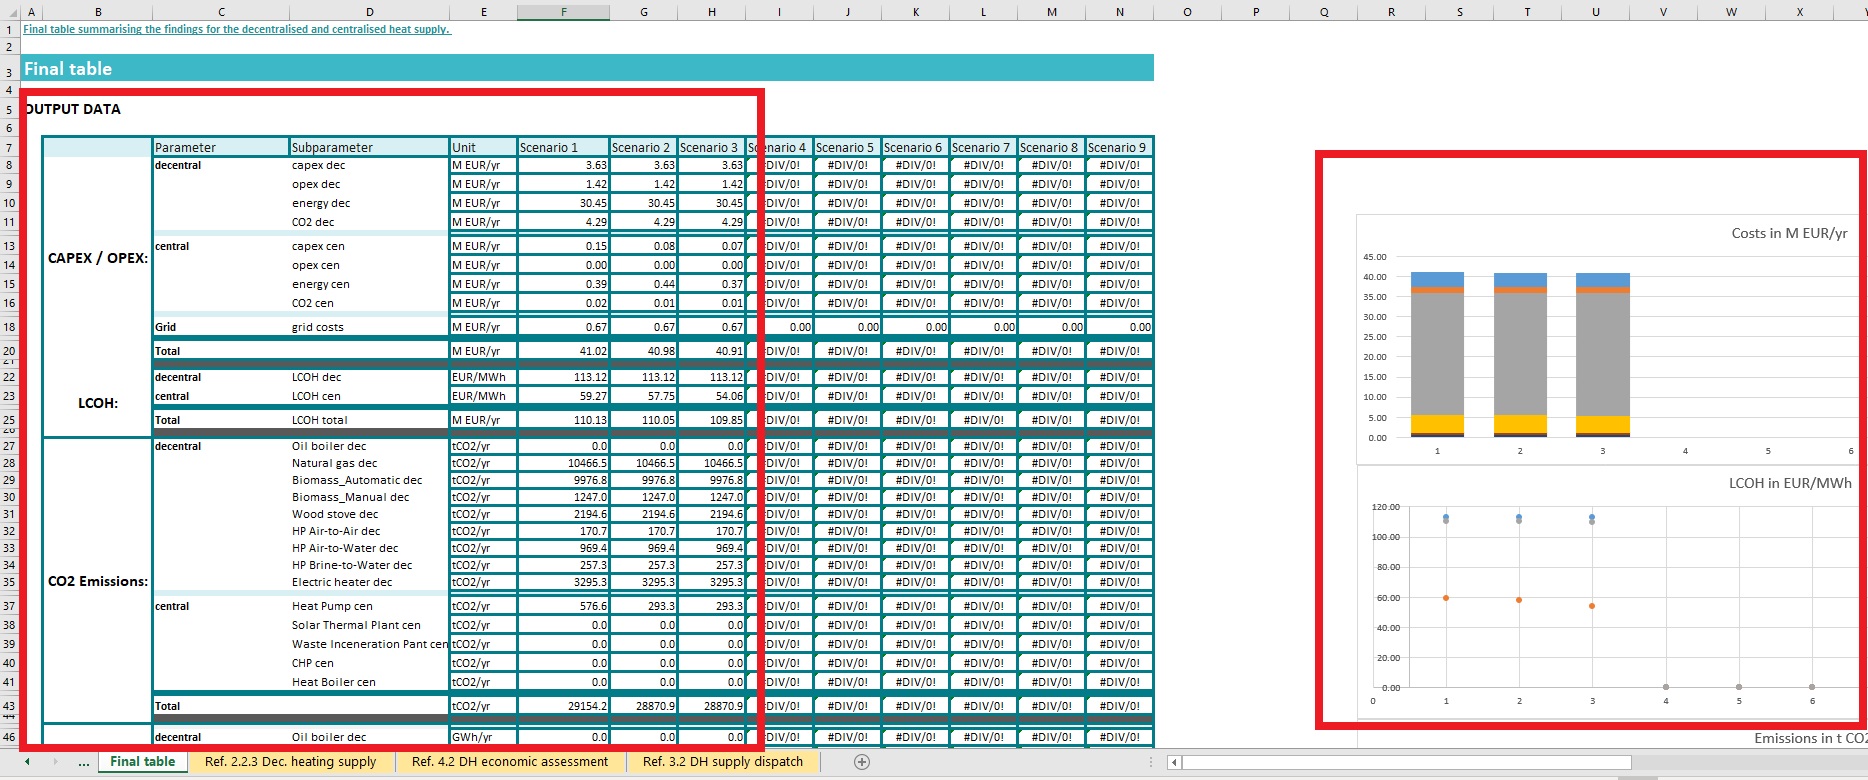
After filling in the scenario data into the three worksheets (Ref. Dec. heating supply, Ref. DH economic assessment, Ref. DH supply dispatch) the indicators for the defined scenarios are automatically calculated in the sheet "Final table". The table in the cells B7:N88 shows the results of these overall scenarios. Indicators are calculated for costs, emissions, energy demand as well as shares of renewable energy and district heating.
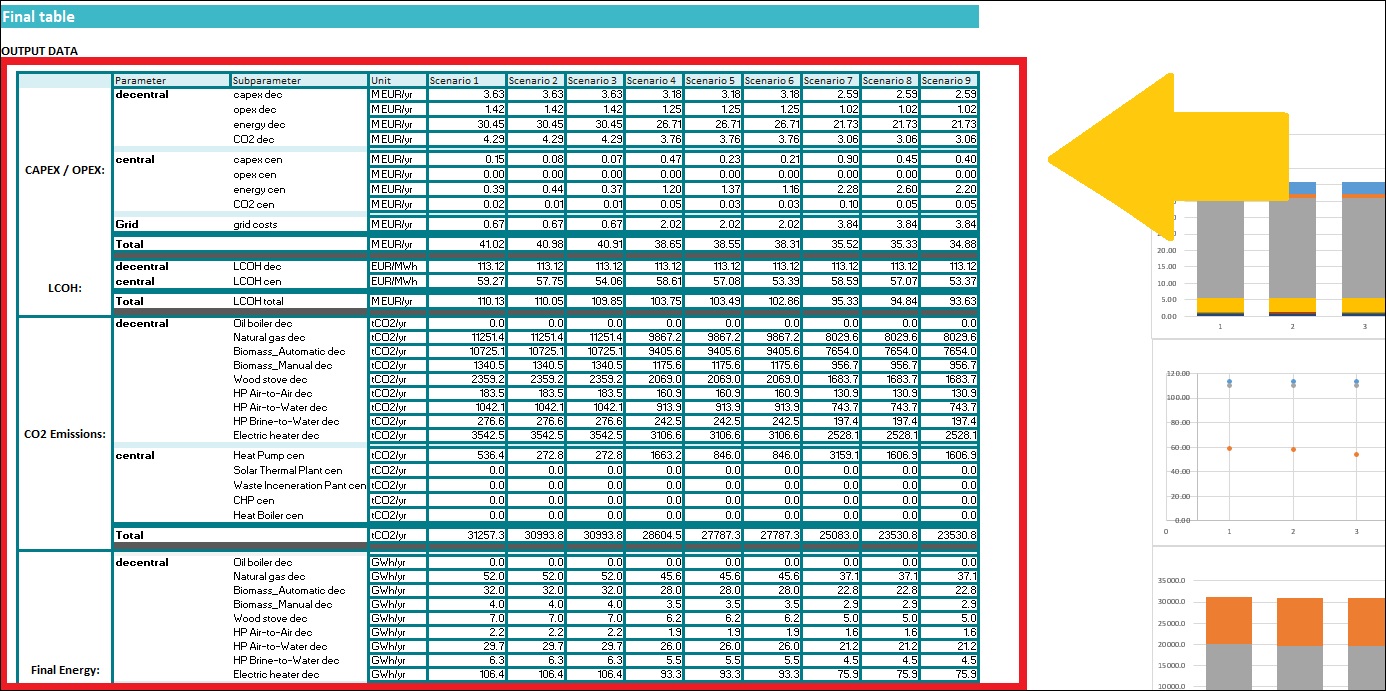
In general, all these results are individually calculated for the decentral as well as the area supplied with district heating and are applied to the overall scenario using their respective shares. They are therefore listed separately as individual components of the respective parameter.
The scenario assessment file shows a split of the overall costs into capital expenditures (CAPEX), operational expenditures (OPEX), expenditures for energy as well as for CO2. These different cost categories are presented both for central and decentral supply in the region. Furthermore, the costs for the distribution grid are shown. All of those cost components are shown in M EUR/yr. Besides the overall yearly costs also the levelised costs of heat supply (LCOH) are shown in the table. They are presented in EUR/MWh Both the yearly costs as well as the LCOH are shown in figures as well. These can be found beside the table as shown in the next figure.
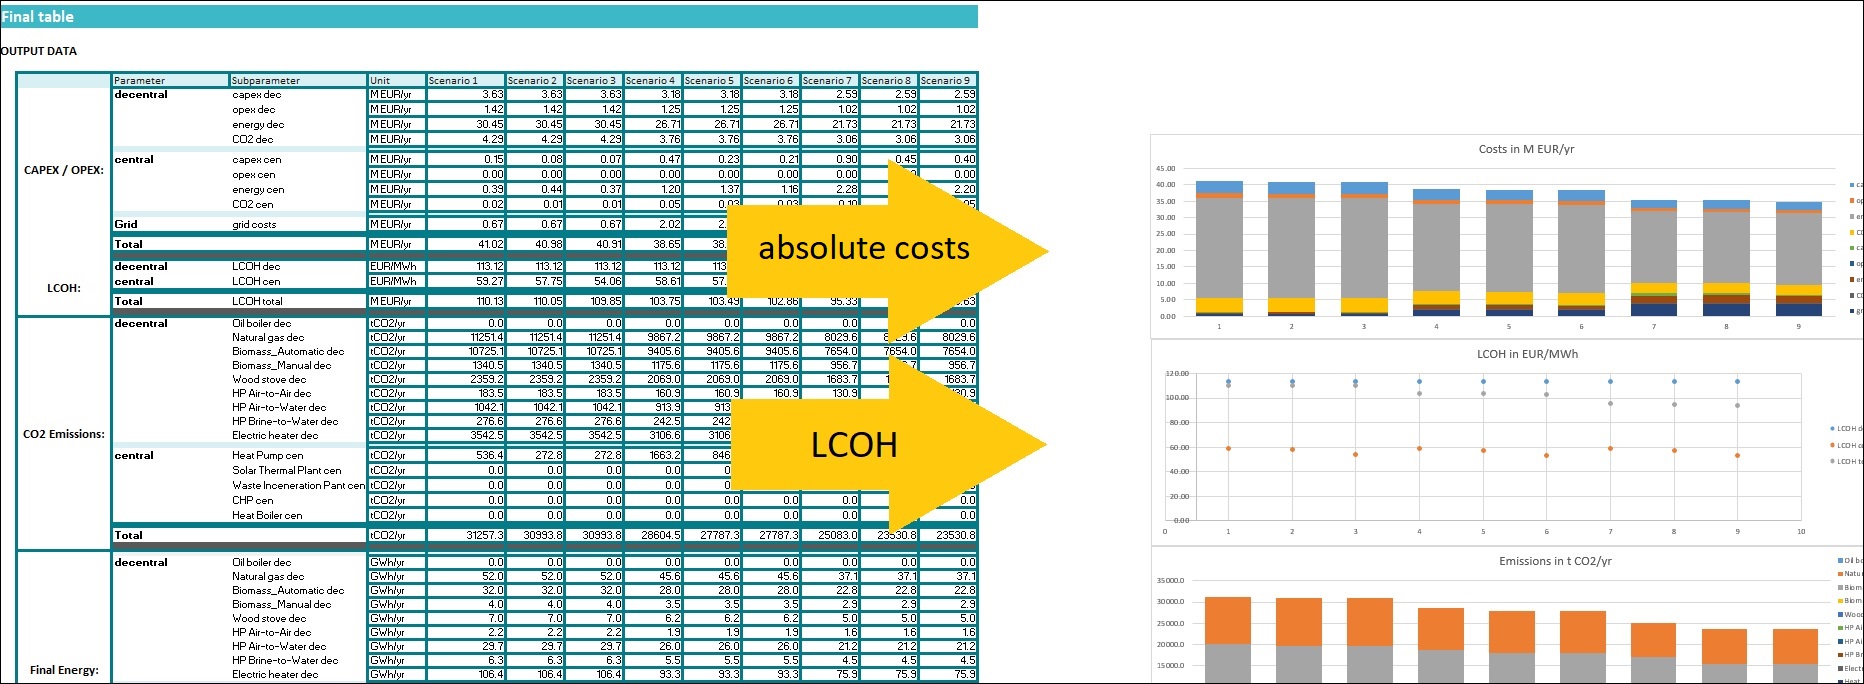
The scenario assessment file also provides the absolute amounts of CO2 emissions in the different scenarios. The values are shown for the different supply technologies distinguishing between individual (decentral) and district heating (central) supply. The values are given in tCO2/yr. Again, the amounts of emissions are also shown in the form of a diagram right beside the table.
In the table also the demands for final and useful energy are presented. In the final energy demand also the losses in the district heating system are contained. Therefore, the final energy demand values for district heating (central) supply reflect the energy carrier demand in the plants of the district heating system. Both, the values for useful and for final energy demand are shown in GWh/yr.
Finally, the table offers a comparison of four different shares: the share of renewable energy in decentral supply, in central supply and in the overall heat supply in the area, and the share of district heating / central supply in the area. As for the other values, these values are also presented in figures right beside the table.
(Tomaszów Mazowiecki)
With the download of the Excel file, you will receive a ready-to-fill version of the scenario assessment. After a successful calculation of scenarios using the modules CM - Decentral heating supply, CM - District heating potential: economic assessment and CM - District heating supply dispatch, the respective results of the modules can be copied into the corresponding sheets of the document. In the following three scenarios for the polish city Tomaszów Mazowiecki are evaluated as an example.
In this example one scenario of decentral heating supply for the city of Tomaszów Mazowiecki in Poland has been calculated using the Hotmaps toolbox together with the sheets in the section building stock according to the procedure described in this section of the page. This scenario for decentral supply has been copied to the scenarios 1, 2 and 3 in the scenario assessment file, worksheet "Ref. Dec. heating supply" in order to use the same individual heating supply scenario in all three overall city scenarios that are compared.
In this example, one scenario of district heating grid construction for the city of Tomaszów Mazowiecki in Poland has been calculated using the Hotmaps toolbox. This scenario has been copied to scenarios 1, 2, and 3 in the scenario assessment file, worksheet "Ref. DH economic assessment" in order to use the same district heating grid construction scenario in all three overall city scenarios that are compared.

In this example, three different scenarios of district heating supply for the city of Tomaszów Mazowiecki in Poland has been calculated using the Hotmaps toolbox. The scenarios reflect different combinations of supply technologies, namely different capacities of heat pumps, excess heat as well as heat only boilers.
After copying the individual data, the compiled scenarios can be examined in the sheet Final Table. On the one hand, there is a table showing the exact results and on the other hand, you can find corresponding graphs on the right side of the table. In this example, the effects of using different capacities of supply technologies in the district heating system can be assessed based on the costs, emissions, energy demand, and shares of renewable energy.
Giulia Conforto and David Schmidinger, in Hotmaps-Wiki, CM-Scenario-assessment (September 2020)
This page was written by Giulia Conforto and David Schmidinger e-think.
☑ This page was reviewed by Marcul Hummel e-think.
Copyright © 2016-2020: Giulia Conforto and David Schmidinger
Creative Commons Attribution 4.0 International License
This work is licensed under a Creative Commons CC BY 4.0 International License.
SPDX-License-Identifier: CC-BY-4.0
License-Text: https://spdx.org/licenses/CC-BY-4.0.html
We would like to convey our deepest appreciation to the Horizon 2020 Hotmaps Project (Grant Agreement number 723677), which provided the funding to carry out the present investigation.
View in another language:
* machine translated