

not logged in | [Login]
![]()
This module scales the default layer with a given factor. The aim is to provide a distribution of heat and cold demand if only the total amount of heat and cold demand is available.
The aim of the calculation module is to quickly obtain a new raster by scaling a raster density map by a user-chosen factor. It generates a new raster by multiplying each cell of the input raster by the given factor.
The input parameters and layers, as well as output layers and parameters, are as follows.
Input layers and parameters are:
Output layers and parameters are:
Each cell's value of the input raster is multiplied by the multiplication factor.
If we know the total consumption of an area, and the indicator Total head demand does not correspond this value, it is possible to scale the heat demand by the ratio (Total_real / Total_default). The following figure gives the example of a multiplication factor value of 0.5.

Here you get the bleeding-edge development for this calculation module.
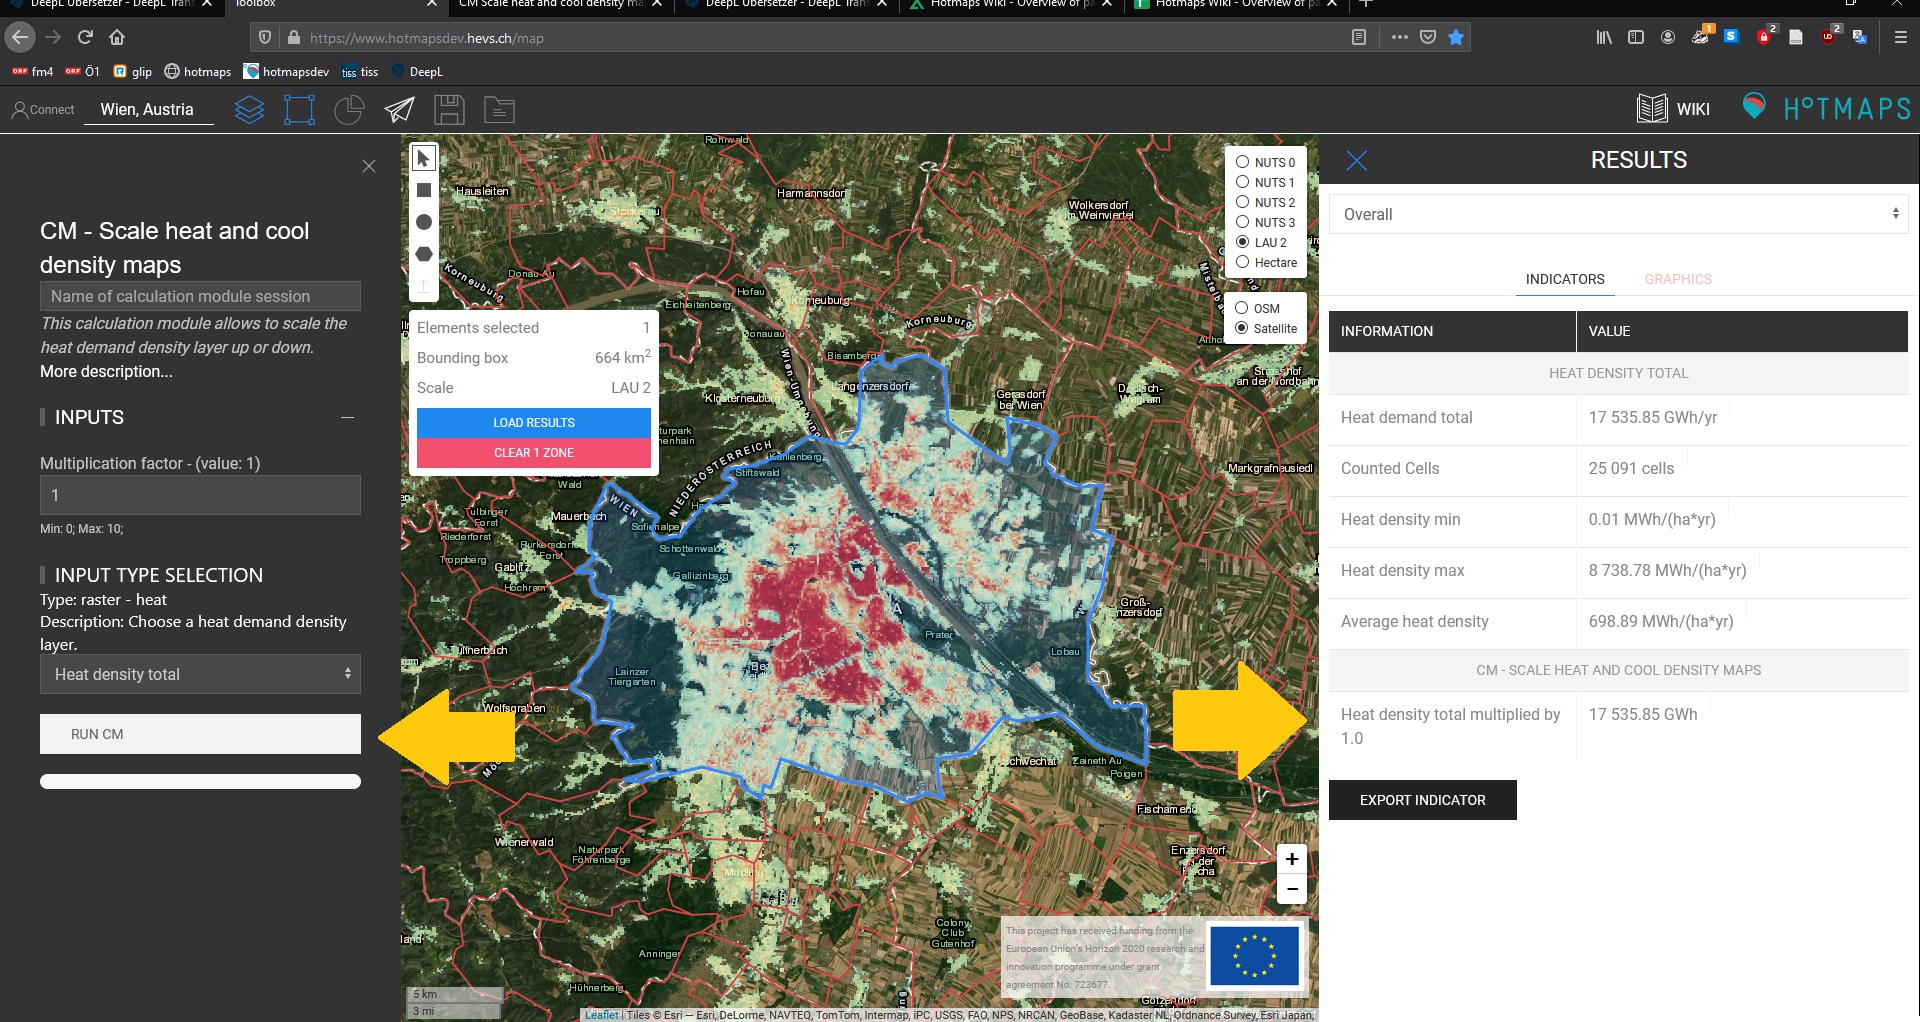
Here, the calculation module is run for the case study of Vienna, Austria. First, use the "Go To Place" bar to navigate to Vienna and select the city. Click on the "Layers" button to open the "Layers" window and then click on the "CALCULATION MODULE" tab. In the list of calculation modules, select "CM - Scale heat and cool density maps".
After pressing run a new density map is calculated on the basis of the selected map. The default value here is the heat density total map.
After the calculation, the total new heat demand is shown on the right side, under indicators. (Here the default value is 1 and therefore no changes occur).
After closing the calculation modules and switching to the layer section, the newly calculated heat density map can be found on the very bottom. It can be downloaded and uploaded again to save it or use it in further calculations.

To Top
Thiery Bernhard, in Hotmaps-Wiki, CM Scale heat and cool density maps (April 2019)
This page was written by Thierry Bernhard CREM.
☑ This page was reviewed by Lesly Houndole and Albain Dufils CREM.
Copyright © 2016-2019: Thierry Bernhard
Creative Commons Attribution 4.0 International License
This work is licensed under a Creative Commons CC BY 4.0 International License.
SPDX-License-Identifier: CC-BY-4.0
License-Text: https://spdx.org/licenses/CC-BY-4.0.html
We would like to convey our deepest appreciation to the Horizon 2020 Hotmaps Project (Grant Agreement number 723677), which provided the funding to carry out the present investigation.
View in another language:
* machine translated